Nifty rebounds after record weekly losing streak
The Nifty index ended its longest weekly losing streak in 25 years with a 1% intraday gain.
The Nifty rebounded after its longest weekly losing streak in 25 years. Today's gains, which saw the index climb around 1% and the Sensex surge as much as 700 points, may reflect value buying after eight consecutive weeks of losses. The decline, which began on August 16, saw the Nifty shed about 8.7%. This eight-week stretch of losses was longer than the seven-week declines recorded during both the 2008 Global Financial Crisis and the 2020 Covid-19 crash.
Key support zone holds but risks remain below 22,600-22,400
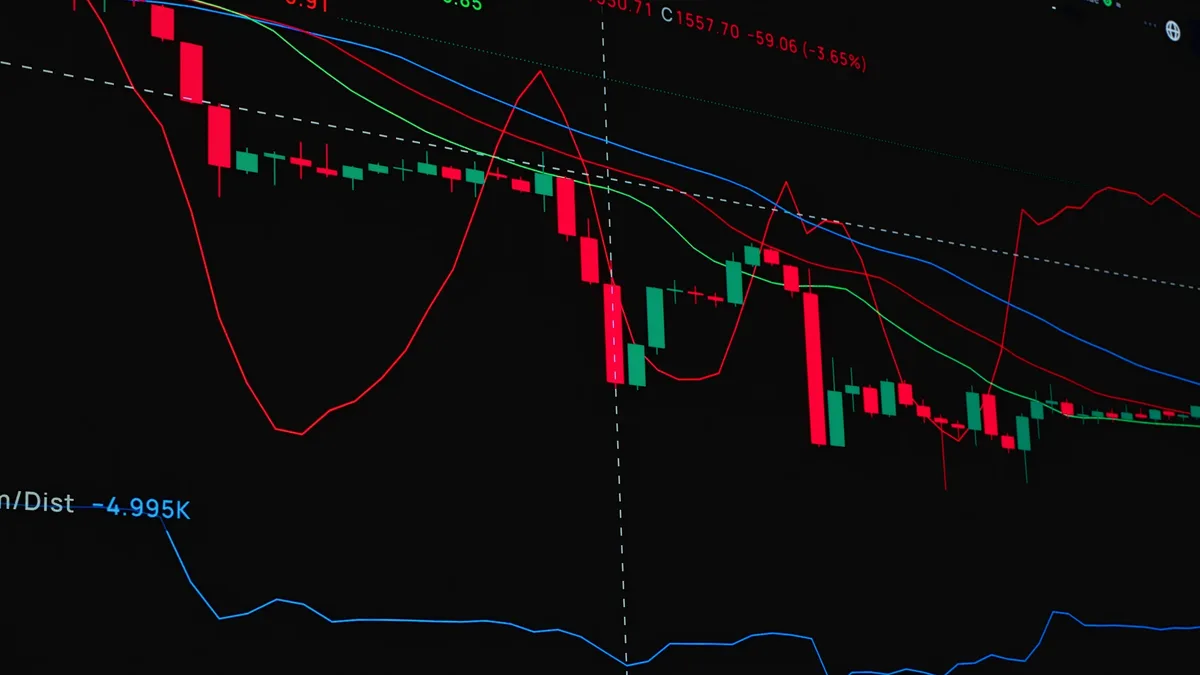
The Nifty is now close to a key horizontal support zone between 21,743 and 22,182. This zone was formed by reaction lows recorded in April 2025 and April 2026. Anand James, Chief Market Strategist at Geojit Investments, noted that "the region has helped reverse major downtrends on the previous two occasions, raising expectations of a similar reversal this time." A break below this support zone would mark the end of the uptrend that has continued since the Covid-19 period and could expose the Nifty to levels of 19,000 and 16,700, which represent the 38% and 50% retracement levels from the Covid low, respectively.
Analysts are watching nearer-term levels closely. Sudeep Shah of SBI Securities said the 22,150-22,100 zone will remain the key support area, with the 22,550-22,600 zone acting as an immediate hurdle. He emphasized that the 22,600-22,400 zone will be key. Rupak De, senior technical analyst at LKP Securities, stated, "As long as Nifty remains below 22,600, there is a high chance that Nifty might test 20,500." A sustained hold above 22,600-22,400 could trigger a pullback. Shah cautioned that the end of the losing streak does not necessarily signal the end of the broader downtrend and that another week of selling pressure remains possible.
Technical breakdown raises alarms as Nifty breaches 200-week moving average
The Nifty's fall below its 200-week moving average has added to the uncertainty. Rupak De said the index has breached this long-term trend indicator for the first time since the Covid crash. This is not a normal breakdown, he added. Historical breaches of this level have led to varied outcomes. In 2008, the Nifty declined 38% after slipping below its 200-week moving average. In 2020, it fell 27%. However, in 2011, 2013 and 2016, the index broke below the average but subsequently reversed after smaller corrections of between 2% and 6%. De noted that the decline may not happen in a straight line and that periodic bounces could emerge.
External pressures from oil and Fed expectations lift rupee, add complexity
External factors provided some relief. Oil prices slipped below $102 per barrel, with Brent crude futures trading near $101.5 and WTI crude futures falling to $90. Higher crude exports from the Middle East and plans by G7 nations to release oil stocks contributed to the decline, though concerns persisted over risks to Gulf oil infrastructure. Concurrently, the probability of a Federal Reserve rate hike at its October meeting fell to around 20% following a weaker-than-expected US jobs report. The easing in oil prices and lower Fed rate hike expectations supported the rupee, which rose 5 paise to 96.20 against the US dollar in early trade.
A decisive breakdown below the 22,600-22,400 zone would increase the risk of another leg lower toward 19,000 and 16,700.