Nifty 50 recovery halts as bearish engulfing
The Nifty 50 index ended a four-session winning streak on Tuesday, closing lower and forming a bearish technical pattern.

The Nifty 50's four-day recovery ended on Tuesday as the index faced selling pressure near the 23,500 mark. It closed at 23,329, down 85.30 points after declining nearly 160 points from its intraday high.
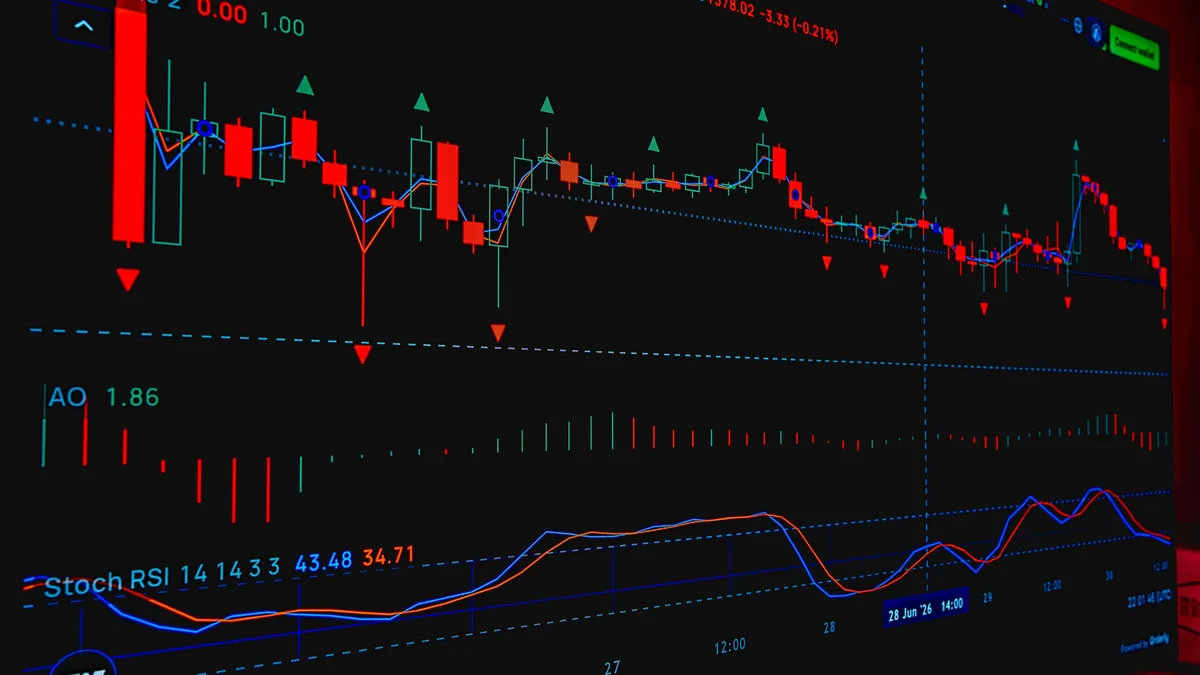
Profit booking at higher levels indicated the recent rebound is facing resistance. The index formed a large bearish candle on the daily chart that completely engulfed the previous session's bullish candle, creating a bearish engulfing candlestick pattern. This suggests caution after the recent rise.
Technical Indicators Weaken
The index had reclaimed its 8-period exponential moving average (8-EMA) in the previous session but slipped back below this short-term trend indicator on Tuesday. From a broader perspective, the Nifty continues to trade below its key short-term, medium-term, and long-term moving averages, indicating a weak underlying trend.
The recent pullback rally retraced around 38.2% of the decline from the September 3 high to the September 16 low. This recovery remains relatively shallow. In a previous retracement, the index had recovered nearly 50% of the fall from the August 3 high to the August 19 low.
The 14-period Relative Strength Index (RSI) has turned lower after the recent recovery. The index is currently trading within the range of the large bearish candle formed on September 15, making the near-term outlook dependent on a decisive breakout.
Key Resistance and Support Levels
Analysts from Dalal Street Investment Journal (DSIJ) identify key price zones. The 23,500-23,600 zone will act as an important resistance area. This region also coincides with a change-in-polarity level, making it a key hurdle.
On the downside, immediate support is placed near 23,286, aligning with Friday's low and Tuesday's session low. A sustained break below this level could increase selling pressure and push the index towards the lower end of the September 15 bearish candle, placed near 23,119.
The horizontal support zone around 23,100-23,120 will be important. A breach of this level could indicate further weakness.
Range-Bound Outlook
At present, the Nifty is positioned between a strong resistance zone near 23,500-23,600 and key support around 23,100-23,120. The index is likely to remain range-bound until it breaks decisively on either side of the September 15 bearish candle.
A breakout above the resistance zone could improve sentiment and support further recovery. A breakdown below the support zone may bring renewed selling pressure.
A Stock in Focus: Inventurus Knowledge Solutions
The report also highlighted movement in Inventurus Knowledge Solutions (IKS). The stock witnessed a strong upmove from its May 18 low to its July 10 high. It then entered a corrective phase, retracing nearly 50% of that previous upmove.
Finding support near the 50% Fibonacci retracement level, the stock resumed its upward movement. On Tuesday, it broke out above a downward-sloping trendline connecting the July 10 high and subsequent lower highs. The breakout was accompanied by improved trading volumes.
Momentum indicators have turned favourable. The 14-period daily RSI has moved into the bullish zone, and the MACD histogram shows a rise in positive momentum.
| Price Level | Significance |
|---|---|
| ₹1,875 | Key level to sustain for a positive near-term outlook |
| ₹1,933 | First potential target |
| ₹2,000 | Short to medium-term target |
| ₹1,795 | Suggested stop loss for traders |
Sustaining above the ₹1,875 level would keep the near-term outlook positive, with potential moves towards ₹1,933 and ₹2,000.